Case Study
Case Study
Retail Ecommerce - Data Analysis & Visualization
Company
Confidential
Company
Confidential
Company
Confidential
Services
Dashboard Development, Data Modeling, Interaction Design
Services
Dashboard Development, Data Modeling, Interaction Design
Services
Dashboard Development, Data Modeling, Interaction Design
Industry
Retail, eCommerce, FMCG
Industry
Retail, eCommerce, FMCG
Industry
Retail, eCommerce, FMCG
Year
2023
Year
2023
Year
2023

Sales Data Visualization with Drill-Down Capabilities
The Challenge
Analyze retail performance across different geographies and product categories
Provide drill-down capability to explore sub-categories and specific regions
Ensure dashboards remain fast and intuitive for regular business use
The Challenge
Analyze retail performance across different geographies and product categories
Provide drill-down capability to explore sub-categories and specific regions
Ensure dashboards remain fast and intuitive for regular business use
The Challenge
Analyze retail performance across different geographies and product categories
Provide drill-down capability to explore sub-categories and specific regions
Ensure dashboards remain fast and intuitive for regular business use
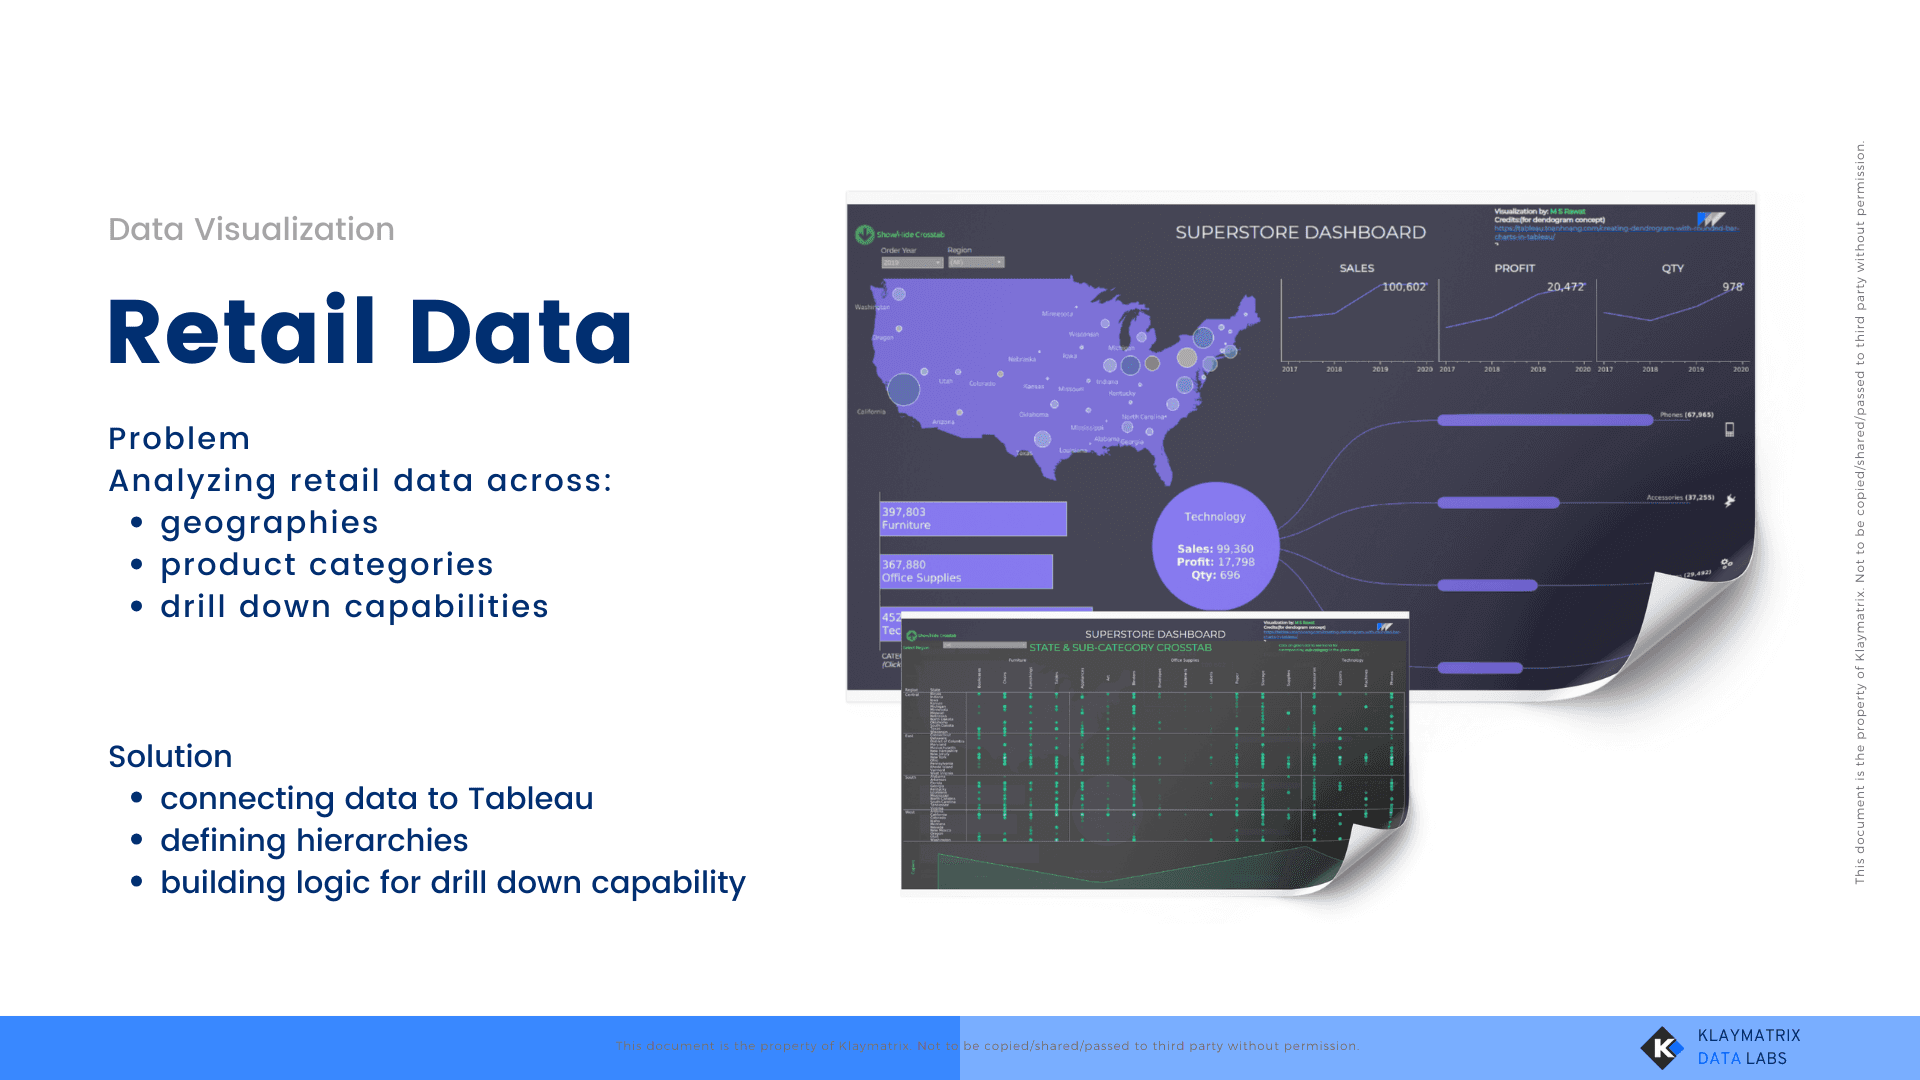
Our Solution
Connected retail data sources directly into Tableau
Defined clear hierarchies for region → city, category → subcategory
Built backend logic to enable seamless drill-down interactivity for business users
Implementation Highlights
Delivered layered dashboards with intuitive navigation
Used Tableau’s hierarchy and filter actions to support multi-level analysis
Ensured high performance even with growing data volumes
Allowed managers to zoom into low-performing SKUs or high-potential geographies with a click
Demonstrated Expertise
Expertise in Tableau’s drill-down and hierarchy logic
Business-focused dashboard design aligned with user intent
Ability to model data for both performance and insight depth
Helped retail team transition from static reports to real-time analytics with minimal training
Ready to Solve Similar Challenges?
Let’s talk. Reach out to us on support@klaymatrix.com
More Cases
More Cases
More Cases
Curious for more? Explore additional case studies and see what’s possible for your business too


Reach out, and we’ll take it from there — with a clear path, structured guidance, and measurable next steps
Phone
+91 9971796261
support@klaymatrix.com
Opening Hours
Mon to Sat: 9.00am - 7.30pm
Sat & Sun: Closed
Services

KLAYMATRIX.
Reach out, and we’ll take it from there — with a clear path, structured guidance, and measurable next steps
Phone
+91 9971796261
support@klaymatrix.com
Opening Hours
Mon to Sat: 9.00am - 7.30pm
Sat & Sun: Closed
Services
Reach out, and we’ll take it from there — with a clear path, structured guidance, and measurable next steps
Phone
+91 9971796261
support@klaymatrix.com
Opening Hours
Mon to Sat: 9.00am - 7.30pm
Sat & Sun: Closed
Services