Case Study
Case Study
Trading Strategy Backtesting
Company
Confidential
Company
Confidential
Company
Confidential
Services
Strategy Simulation, Performance Analysis, Portfolio Modeling
Services
Strategy Simulation, Performance Analysis, Portfolio Modeling
Services
Strategy Simulation, Performance Analysis, Portfolio Modeling
Industry
Financial Markets, Trading
Industry
Financial Markets, Trading
Industry
Financial Markets, Trading
Year
2023
Year
2023
Year
2023

Trading Strategy Backtesting
The Challenge
Validate the viability of a custom trading strategy using real-time and historical market data
Incorporate multiple data streams via APIs
Measure key metrics like drawdown, Sharpe ratio, and overall returns
Simulate dynamic portfolio behavior with buy/sell signals
The Challenge
Validate the viability of a custom trading strategy using real-time and historical market data
Incorporate multiple data streams via APIs
Measure key metrics like drawdown, Sharpe ratio, and overall returns
Simulate dynamic portfolio behavior with buy/sell signals
The Challenge
Validate the viability of a custom trading strategy using real-time and historical market data
Incorporate multiple data streams via APIs
Measure key metrics like drawdown, Sharpe ratio, and overall returns
Simulate dynamic portfolio behavior with buy/sell signals
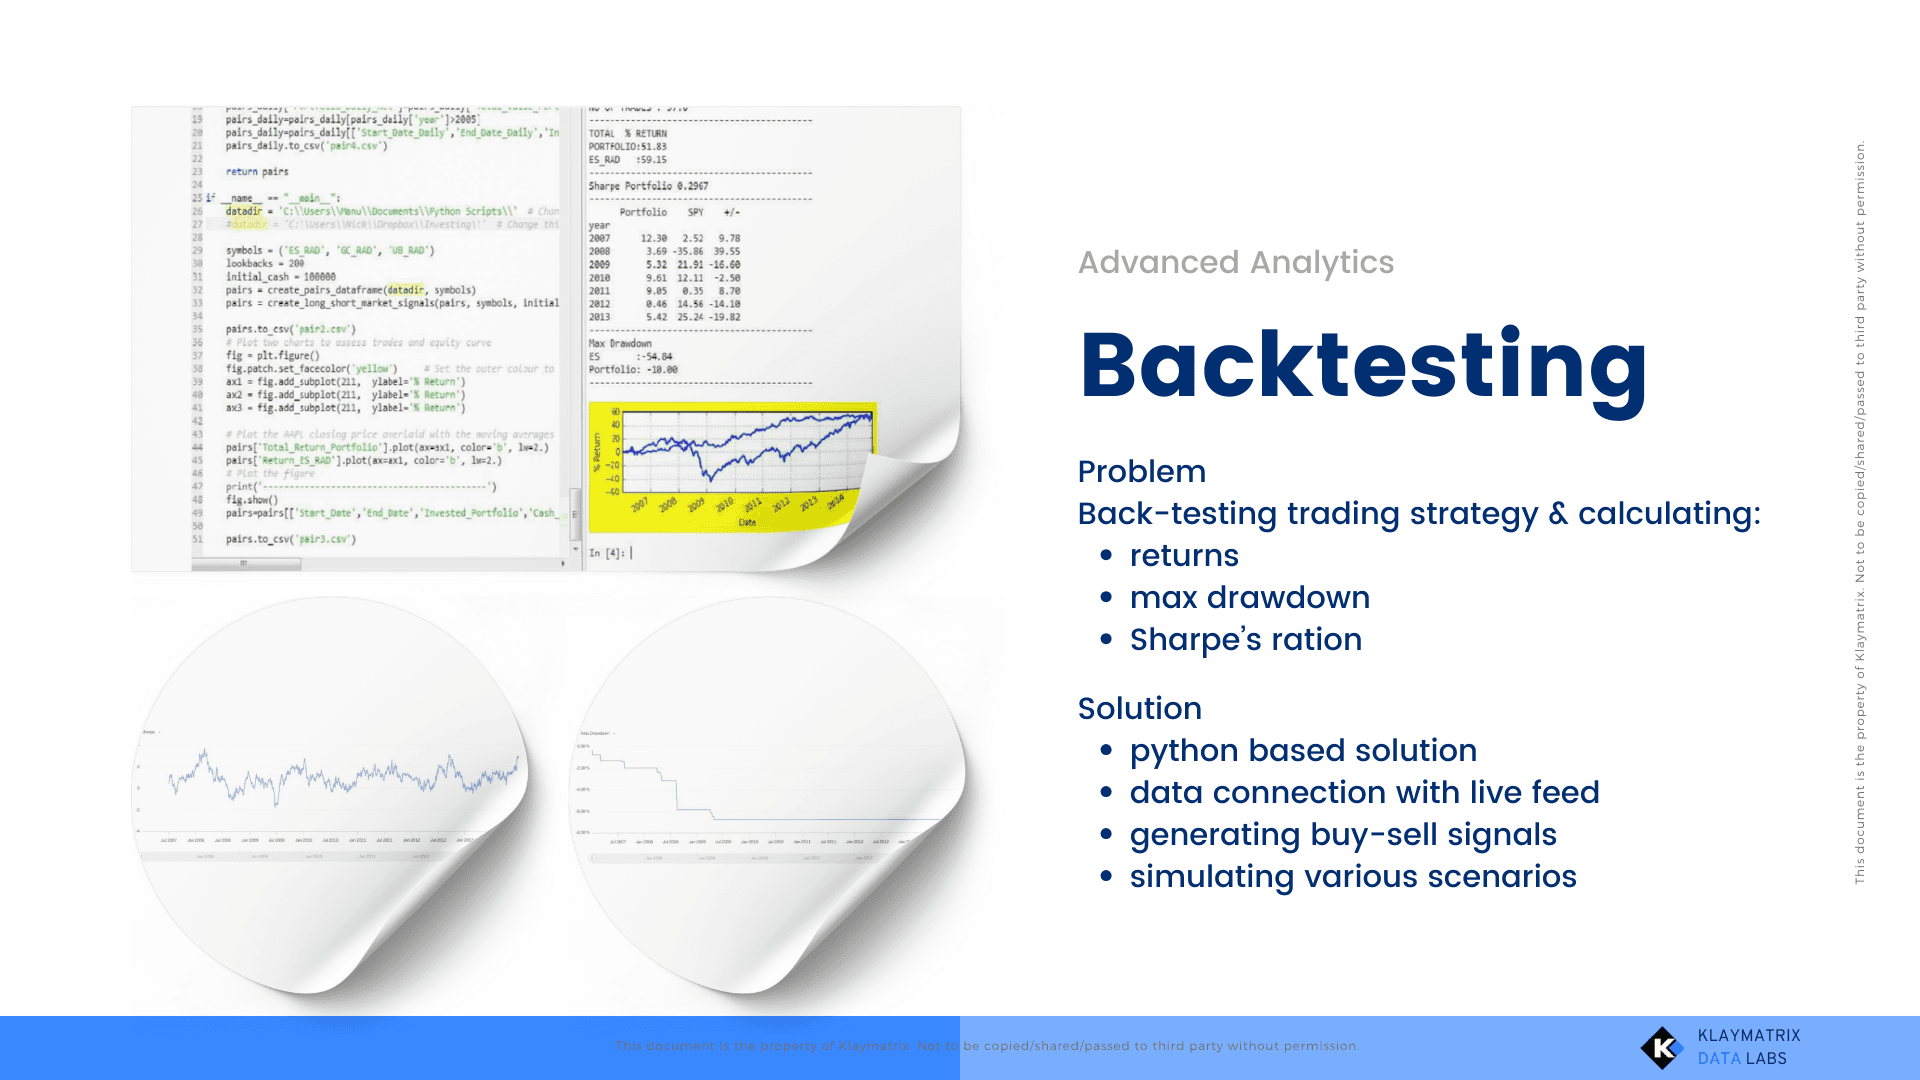
Our Solution
Developed a Python-based backtesting engine tailored to client’s strategy
Integrated market data via APIs to pull relevant time-series data
Programmed logic to simulate buy/sell decisions
Calculated performance metrics: Max Drawdown, Sharpe Ratio, Total Return
Modeled dynamic portfolio allocation to reflect real trading behavior
Used VBA to automate calculations and backend logic
Developed automated reports across separate sheets for daily and weekly review
Enabled collation of data from multiple Excel files
Implementation Highlights
Data fetched using robust API handling with fallback mechanisms
Extensive use of Python and its libraries
Visualized performance and signal points using Matplotlib
Modular code allowing client to adjust parameters or test variations
Demonstrated Expertise
Advanced use of Python for financial analysis and strategy validation
Practical risk analysis using industry-standard metrics (Sharpe ratio, drawdown)
API-driven data handling and dynamic simulation of portfolio behavior
Delivered reusable and customizable script enabling client-led experimentation
Ready to Solve Similar Challenges?
Let’s talk. Reach out to us on support@klaymatrix.com
More Cases
More Cases
More Cases
Curious for more? Explore additional case studies and see what’s possible for your business too


Reach out, and we’ll take it from there — with a clear path, structured guidance, and measurable next steps
Phone
+91 9971796261
support@klaymatrix.com
Opening Hours
Mon to Sat: 9.00am - 7.30pm
Sat & Sun: Closed
Services

KLAYMATRIX.
Reach out, and we’ll take it from there — with a clear path, structured guidance, and measurable next steps
Phone
+91 9971796261
support@klaymatrix.com
Opening Hours
Mon to Sat: 9.00am - 7.30pm
Sat & Sun: Closed
Services
Reach out, and we’ll take it from there — with a clear path, structured guidance, and measurable next steps
Phone
+91 9971796261
support@klaymatrix.com
Opening Hours
Mon to Sat: 9.00am - 7.30pm
Sat & Sun: Closed
Services